R for Clinical Statistics is a gentle, hands-on course for clinicians and clinical researchers. You write real code against real-feeling clinical data from the first lesson, and every step gives you instant, kind feedback. No prior programming needed.
Why this course
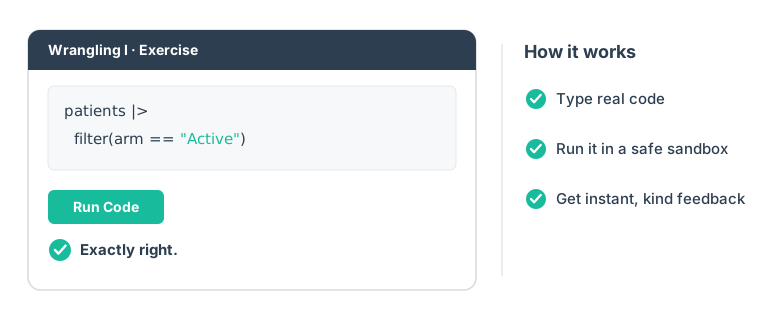
The idea is simple: do something real in R within minutes, then build from there. Three promises hold in every lesson:
- You cannot break anything. Each exercise is a safe sandbox. Run it, get it wrong, run it again.
- Red text is not failure. An error is R asking for a small change, nothing more.
- You are never stuck. A hint and a full solution sit one click away.
What you will be able to do
By the end of the course you can take a clinical dataset from a raw file to a result you would put in a paper:
- pick the rows and columns you want, count groups, and sort (
filter,select,count,arrange) - build new columns and summarise by treatment group (
mutate,group_by,summarise) - reshape between long and wide, and join tables together (
pivot_wider,left_join) - load and clean real data: inconsistent categories, numbers stored as text, missing values
- draw the clinical figures a paper needs, and build a “Table 1” in one line
- describe a variable properly, run a t-test or chi-squared test, and tidy the result
- fit a linear or logistic regression, with odds ratios you can report
- run a Kaplan-Meier and Cox survival analysis, censoring included
- write the whole analysis up as a Quarto report that rebuilds itself from the data on demand
The lessons
The course is a set of interactive tutorials you run on your own computer.
Part 1 · Foundations
- 0 · Why R for clinical data — what a script buys you, and your first line of R.
- 1 · Tidy data as design — the one idea about table shape that makes everything else easy.
- 2 · The building blocks of R — objects, value types, and what a data frame is.
-
3 · Wrangling I —
filter,count,arrange,select, and the pipe. -
4 · Wrangling II —
mutate, and grouped summaries. - 5 · Tidy data in practice — reshaping and joining repeated measurements.
Part 2 · Real data
- 6 · Reading & cleaning data — loading a file, and fixing the three messes you meet most.
- 7 · Visualisation I — the ggplot2 grammar: scatter, box and bar plots.
- 8 · Visualisation II — trends over time, faceting, and figures ready for a paper.
-
9 · Summary tables — the “Table 1” every clinical paper opens with, via
finalfit.
Part 3 · Analysis
- 10 · Describing data — histograms first, then choosing mean/SD or median/IQR.
-
11 · Comparing groups — the t-test, the chi-squared test, and tidy results with
broom. - 12 · Regression — linear and logistic models, baseline adjustment, odds ratios.
- 13 · Survival analysis — censoring, Kaplan-Meier curves, log-rank, Cox hazard ratios.
Part 4 · Reporting
- 14 · Reproducible reports — the capstone: the whole trial analysis as a Quarto report, rendered to a real document on your machine.
Each interactive lesson ends with open practice exercises, graded as you go.
Get started in three steps
- Install R and RStudio, both free.
- Install the course package.
- Run
learn()to see the lessons, thenlearn("m0")to open the first.
The Get started guide walks through each step with the exact commands. In a hurry? Try R in your browser first, with nothing to install.